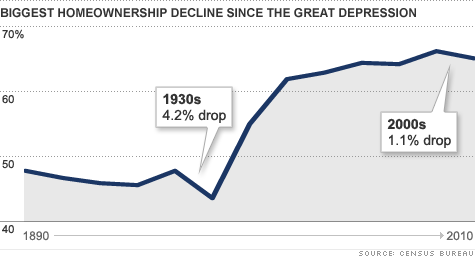
NEW YORK (CNNMoney) -- The percentage of Americans who owned their homes has seen its biggest decline since the Great Depression, according to the U.S. Census Bureau.
The rate of home ownership fell to 65.1% in April 2010, 1.1 percentage points lower than it was in 2000. The decline was the biggest drop since the 1930s, when home ownership plunged 4.2%.
The most recent decade-over-decade drop, however, only tells half the story.
Home ownership during the 2000s "was really high in the middle of the decade, up to almost 70% at one point around 2004," said Ellen Wilson, a survey statistician with the bureau.
The crash from that peak was more than 4 percentage points in just about five years -- a far more dramatic decline than the 1.1% drop over the 10-year period.
Certain regions have been hit harder than others. The West had the lowest home ownership rate at 60.5%, while the Midwest had the highest rate at 69.2%.The South came in at 66.7% and the Northeast at 62.2%.
Among the states, New York had the lowest home ownership rate of 53.3%, but the District of Columbia's home ownership rate was below that at 42%.
West Virginia (73.4%) led the way with the highest home ownership rate, while Minnesota (73%), Michigan, Delaware and Iowa (all 72.1%) were also well above the norm.
Number of vacant homes grows by 44%
Thanks to the housing bust there has been a substantial increase in empty homes. The number of vacant housing units jumped an astonishing 43.8% to 15 million (or 11.4% of all housing units) in 2010, up from 10.4 million in 2000.
During that 10-year period, the number of homes in the U.S. increased by 16 million to 131.7 million housing units, according to Census.
Many Sun-Belt states suffered large vacancy increases. In Nevada, ground zero for foreclosures over the past few years, vacancies grew nearly 120% to 14.3% of all homes. Georgia vacancies jumped 82.7%, Florida's 62.6% and Arizona's 61%.
Although vacancies in Maine grew by only 23%, the state had the highest percentage of vacant homes overall at 22.8%. Vermont was close behind with 20.5% of its homes empty. Florida was third with 17.5%.
Many of the nation's residents have also become renters, especially in large metropolitan areas.
Of the 10 largest cities, New York had the highest ratio with a whopping 69% of all homes in the five boroughs -- Manhattan, Brooklyn, Queens, the Bronx and Staten Island -- occupied by renters. Los Angeles had a 61.5% rental rate and Dallas was 55.9%.
San Jose had the lowest percentage of renters for any of the 10 largest cities with just 41.5%. San Antonio (43.5.%) and Phoenix (42.4%) had comparatively few renters as well.

